The Age of Congress
How old is Congress?
years old, on average
The average voting member of the 119th Congress is about 11 years older than the average American adult.†
The Two Chambers
The Senate
years old, on average

Oldest member
Chuck Grassley, b. 1933
The House
years old, on average

Oldest member
Harold Rogers, b. 1937
The Decades
Members of Congress by the decade of life they are in — how old they are now, not the decade they were born.
134 are 70 or older · 196 have reached 65
Age is the age each member reaches during the edition year, computed from birth year — the same convention as The Shape of Congress — so a member’s age today sits a year below the figure shown until their birthday falls.
The Rankings
The Ten Oldest Senators
- 1
 93.0
93.0Chuck Grassley
R–IA11 terms in Congress · first took office 1975
- 2
 85.1
85.1Bernard Sanders
I–VT12 terms in Congress · first took office 1991
- 3
 84.6
84.6Mitch McConnell
R–KY7 terms in Congress · first took office 1985
- 4
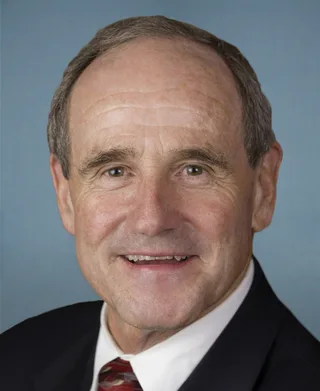 83.4
83.4James E. Risch
R–ID3 terms in Congress · first took office 2009
- 5
 82.5
82.5Angus S. King, Jr.
I–ME3 terms in Congress · first took office 2013
- 6
 81.9
81.9Richard J. Durbin
D–IL12 terms in Congress · first took office 1983
- 7
 80.6
80.6Richard Blumenthal
D–CT3 terms in Congress · first took office 2011
- 8
 80.2
80.2Edward J. Markey
D–MA23 terms in Congress · first took office 1975
- 9
 79.7
79.7Jeanne Shaheen
D–NH3 terms in Congress · first took office 2009
- 10
 79.4
79.4Peter Welch
D–VT9 terms in Congress · first took office 2007
…and the ten youngest
- 1
 39.6
39.6Jon Ossoff
D–GA1 term in Congress · first took office 2021
- 2
 40.9
40.9Tim Sheehy
R–MT1 term in Congress · first took office 2025
- 3
 44.2
44.2Andy Kim
D–NJ5 terms in Congress · first took office 2019
- 4
 44.7
44.7Katie Boyd Britt
R–AL1 term in Congress · first took office 2023
- 5
 46.8
46.8Josh Hawley
R–MO2 terms in Congress · first took office 2019
- 6
 46.9
46.9Ruben Gallego
D–AZ6 terms in Congress · first took office 2015
- 7
 47.2
47.2Jim Banks
R–IN5 terms in Congress · first took office 2017
- 8
 49.4
49.4Tom Cotton
R–AR3 terms in Congress · first took office 2013
- 9
 50.2
50.2Elissa Slotkin
D–MI4 terms in Congress · first took office 2019
- 10
 51.3
51.3Eric Schmitt
R–MO1 term in Congress · first took office 2023
The Ten Oldest Representatives
- 1
 88.8
88.8Harold Rogers
R–KY-523 terms in Congress · first took office 1981
- 2
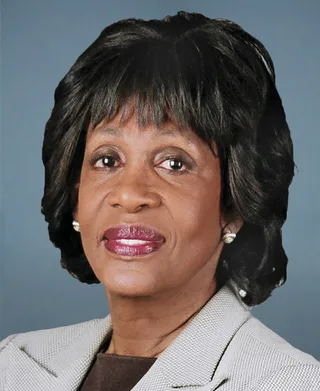 88.1
88.1Maxine Waters
D–CA-4318 terms in Congress · first took office 1991
- 3
 87.3
87.3Steny H. Hoyer
D–MD-523 terms in Congress · first took office 1981
- 4
 86.5
86.5Nancy Pelosi
D–CA-1120 terms in Congress · first took office 1987
- 5
 86.2
86.2James E. Clyburn
D–SC-617 terms in Congress · first took office 1993
- 6
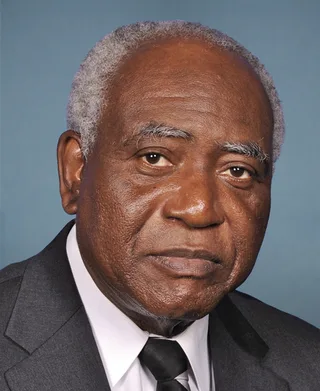 85.1
85.1Danny K. Davis
D–IL-715 terms in Congress · first took office 1997
- 7
 84.9
84.9John R. Carter
R–TX-3112 terms in Congress · first took office 2003
- 8
 83.9
83.9Frederica S. Wilson
D–FL-248 terms in Congress · first took office 2011
- 9
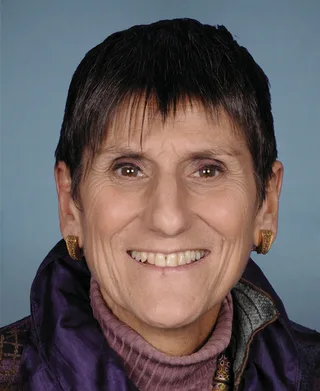 83.6
83.6Rosa L. DeLauro
D–CT-318 terms in Congress · first took office 1991
- 10
 83.3
83.3Virginia Foxx
R–NC-511 terms in Congress · first took office 2005
…and the ten youngest
- 1
 29.7
29.7Maxwell Frost
D–FL-102 terms in Congress · first took office 2023
- 2
 32.6
32.6Brandon Gill
R–TX-261 term in Congress · first took office 2025
- 3
 32.7
32.7Addison P. McDowell
R–NC-61 term in Congress · first took office 2025
- 4
 34.4
34.4Everton Blair Jr.
D–GA-131 term in Congress · first took office 2026
- 5
 34.5
34.5Yassamin Ansari
D–AZ-31 term in Congress · first took office 2025
- 6
 35.4
35.4Abraham J. Hamadeh
R–AZ-81 term in Congress · first took office 2025
- 7
 36.2
36.2Sarah McBride
D–DE-AL1 term in Congress · first took office 2025
- 8
 36.5
36.5Robert P. Bresnahan, Jr.
R–PA-81 term in Congress · first took office 2025
- 9
 37.0
37.0Alexandria Ocasio-Cortez
D–NY-144 terms in Congress · first took office 2019
- 10
 37.4
37.4Anna Paulina Luna
R–FL-132 terms in Congress · first took office 2023
Across the Aisle
On average, the two parties are the same age.
Democrats
60.2
years old, on average
Republicans
59.7
years old, on average
0.5 years apart — a difference too small to call, and statistically indistinguishable.
- 18 Democrats
- 2 independents
- 7 Republicans
Of the 27 members who reach 80 or older this year, 18 are Democrats. The oldest members — and only the oldest — skew to one party.
The tilt is a House story and an extreme-tail story at once: 28% of House Democrats are 70 or older, against 17% of Republicans. Below the very top of the age curve the two parties track each other almost exactly — gerontocracy, on this evidence, is bipartisan, and the single oldest member of Congress, Chuck Grassley, is a Republican.
Party is each member’s current-term party; the 3 independents are counted on their own, not with the party they caucus with. Ages use the same edition-year convention as the sections above. The average comparison is a Welch two-sample t-test (unequal variance) of Democratic against Republican ages — the gap is 0.5 years, well within the range chance produces. The tail figures are plain counts of the roster at several age thresholds (65, 70, 75, 80); because more than one threshold was examined, they are reported as counts rather than as significance tests.
The Map
79.4% of representatives are older than the median adult in the district they represent. Nationally, that median is 47.5.
Each of the 435 House districts is shaded by its age gap: the representative’s age at the edition date minus the median age of adults 18 and older living in the district. District medians are derived from U.S. Census Bureau, 2024 American Community Survey 1-Year Estimates, table B01001 (Sex by Age), by interpolating across the 18+ age brackets. The scale is clamped at ±30 years and is symmetric about zero, so a gap of a given size is shaded with the same strength whichever way it runs; 2 vacant seats have no member and are hatched rather than shaded. Geography: U.S. Census Bureau TIGER/Line, 119th Congress, projected to Albers USA.
The Shape of Congress
- Democrats
- Republicans
- Independents
- U.S. adult population
Voting members binned by the age each reaches during the edition year, computed from birth year; each dot is one member. Population silhouette: U.S. Census Bureau, Vintage 2025 National Population Estimates (NC-EST2025), rescaled to the member count.
The Long View
Two centuries of a slow, uneven climb. Averages are computed from each Congress’s roster on its convening date; the earliest figures rest on incomplete birth records and are drawn accordingly.
Why It Stays Old
It is not that the same people will not leave. The people arriving are older.
House turnover has not fallen — the median age of a newly arriving representative has risen from 39 in 1979 to 50 today. Replacement no longer makes the chamber younger.
The median dollar given to federal campaigns comes from a donor aged
66
- Voters mildly prefer younger candidates. Across sixteen candidate-choice experiments in seven democracies, older hypothetical candidates were consistently less likely to be favored (Eshima & Smith, Journal of Politics, 2022).
- The bottleneck is the nomination, not the election. Parties field few young candidates and place the ones they do field in unwinnable districts; in the 2020 House races, primary candidates averaged 51.5 years old and primary winners 54 (Stockemer, Thompson & Sundström, Electoral Studies, 2023; Stockemer & Sundström, Government and Opposition, 2023).
- Turnover rose while the chamber aged. Average House tenure has fallen since 2010 even as the median age climbed — the chart above is why: the seats change hands, and the new hands are older (The Age Divide, 2023, corroborated by this page’s own series).
The arrivals series counts each person once, at the Congress where their first voting House term began; ages are taken at that Congress’s convening date, the same basis as The Long View. The build validates the series against published figures for 1979 and the current Congress and fails rather than shipping a mismatch. Findings quoted are from the peer-reviewed studies cited beside them.
Shared Birthdays
There are 533 voting members and 366 days to go around. 428 of them — 80% — share a birthday with at least one colleague. And 104 days of the year, nearly a third of the calendar, belong to nobody at all.
428 of 533 members share a birthday with at least one colleague. 104 days belong to no one.
Both numbers run ahead of chance, and that is the more interesting finding. Scatter 533 birthdays at random and you would expect about 388 sharing pairs and about 85 empty days. Congress has more of both — more crowding and more emptiness at the same time, which sounds like a contradiction and is not. It is what clustering looks like. Births are not spread evenly across the year: they run heavy in late summer and thin around the holidays, and a calendar with popular days on it necessarily has unpopular ones too. Crowd the peaks and you empty the troughs.
533 people is far too small a sample to prove any of that. This is a pattern consistent with the seasonality demographers have measured in U.S. births for decades — not evidence of it, and not a fact about Congress. It is one of the few things on this page that is not.
Every date a birthday can fall on, including February 29 — one member, Ben Cline, has it. A “sharing pair” is any two members born on the same month and day, counted once; a day with 6 members on it therefore contributes 15 pairs, not 6. The random baseline is the textbook uniform model — every birthday equally likely, February 29 ignored: expected pairs are n(n−1)/2 ÷ 365 and expected empty days are 365 × (1 − 1/365)n, which at n = 533 gives 388.4 and 84.6. The calendar drawn above has 366 days while that baseline has 365; running it on 366 instead gives 387.4 pairs and 85.1 empty days, so the excess holds under either convention and is not an artifact of the choice. Voting members only, on the same basis as every other figure here.
The Generation Gap
- Congress
- U.S. adults 25+
Silent
−2.0
Boomer
+14.4
Gen X
+11.7
Millennial
−16.3
Gen Z
−7.7
Generations follow the Pew Research Center’s birth-year bands: Silent 1928–1945, Boomer 1946–1964, Gen X 1965–1980, Millennial 1981–1996, Gen Z 1997–2012. The Congress side is the 533 voting members by birth year. The country side is derived from U.S. Census Bureau, Vintage 2025 National Population Estimates (NC-EST2025) by mapping each band to the ages it spans as of 2025 and summing the five-year bins, interpolating within a bin where a band splits it. Those bins begin at 25, so the baseline is adults 25 and older rather than all adults 18 and older; a full 18+ baseline would raise Gen Z’s share and lower every other one. The five bands cover ages 25–97, leaving adults aged 98 and older — who predate the Silent Generation — in no band, which is why the country’s shares stop just short of 100%. The House requires its members to be 25 and the Senate 30, so exact parity is impossible by construction.
Methodology
- Ages
- Ages are computed from each member’s date of birth, anchored at midnight Eastern Standard Time, using a mean Gregorian year of 365.2425 days. The clocks on this page advance in real time; nothing is estimated between updates.
- Members
- Averages cover voting members only: senators, and representatives of the fifty states. The 6 non-voting House members — the territorial delegates and the Resident Commissioner of Puerto Rico — are excluded from House averages. Vacant seats reduce the divisor rather than being imputed — figures are currently based on 100 sitting senators (of 100 seats) and 433 voting representatives (of 435 seats).
- Party
- “Across the Aisle” compares members by their current-term party. Party mean ages use the same edition-year age convention as the rest of the page. The average Democratic–Republican comparison is a Welch two-sample t-test, which does not assume the two parties’ age spreads are equal; the difference is well within what chance produces, so the two averages are treated as indistinguishable. The tail figures — how many members pass 65, 70, 75 and 80 — are plain counts, and because several thresholds were examined they are reported as counts rather than as significance tests. The 3 independents (Sanders and King in the Senate, and one representative) are shown on their own and are never folded into the party they caucus with.
- Sources
- Membership, birth dates, party, and term histories come from the @unitedstates congress-legislators dataset (CC0), maintained within days of congressional changes; this site rebuilds from it daily. The birth date of every member shown with a portrait — the oldest and youngest of each chamber — is additionally cross-checked against Wikidata at build time; the site does not publish if the two sources disagree.
- History
- Historical averages are computed from the same project’s records of the roughly 12,500 people who have served since 1789: for each Congress, the mean age of members serving on its constitutional first day (March 4 through the 73rd Congress, January 3 thereafter). Birth dates are unknown for 18% of the 2,585 people whose service ended before 1850 — those members are excluded and affected years are drawn lighter. From 1850 onward coverage never falls below 92.3% (the 32nd Congress, 1851); it is short of 99% in 8 of the 88 Congresses since. Values were validated against Congressional Research Service figures for recent Congresses and FiveThirtyEight’s member-level dataset (66th–118th Congresses). The chart’s U.S. line is the median age of adults 18 and older, 1980 to the present, derived from Census Bureau single-year-of-age estimates (five keyless published series) by linear interpolation; it is fixed history, derived once and committed, and each build checks its endpoint against the independently derived population baseline before publishing.
- Arrivals
- “Why It Stays Old” counts a person as a new House member exactly once, at the Congress where their earliest voting House term began — a returning member counts at their first arrival, a representative who becomes a senator does not count twice, and territorial delegates never count. Cohort ages are medians taken at the convening date. The series is recomputed from the rosters each build and validated against the published medians for 1979 (≈39) and the current Congress (≈50) before it can publish.
- Districts
- The map compares each representative against the people they represent. District age is the median age of adults 18 and older, derived from U.S. Census Bureau, 2024 American Community Survey 1-Year Estimates, table B01001 (Sex by Age), by interpolating across the published 18+ age brackets; the national figure on that basis is 47.5 years. Boundaries are the 119th-Congress districts, which match this roster seat for seat. The gap is the member’s age at the edition date minus that median, so it moves with the roster rather than with the reader’s clock. Of 435 districts, 433 have a sitting member and 2 are vacant; vacant seats are hatched, not shaded, because an empty seat has no age and is not a gap of zero.
- Map
- Districts are drawn from U.S. Census Bureau TIGER/Line cartographic boundaries for the 119th Congress, projected to Albers USA with Alaska and Hawaii inset. It is a real geographic map, so a physically small urban district reads small and a large rural one large; the color, not the area, carries the data. Public domain.
- Birthdays
- Birth dates come from the same @unitedstates congress-legislators dataset (CC0) as every other figure here, and the comparison covers voting members only — 533 of them, on the same basis as the averages above. The calendar carries all 366 dates a birthday can fall on; the roster currently occupies 262 of them and leaves 104 empty. The random baseline against which those are measured is the textbook uniform model, in which every birthday is equally likely and February 29 is ignored: n(n−1)/2 ÷ 365 expected sharing pairs, and 365 × (1 − 1/365)n expected days with nobody. Only birth years are shown by name; the section makes no claim about why the year is shaped the way it is.
- Portraits
- Portraits are official congressional photographs (public domain), courtesy of the U.S. Senate Historical Office and the Collection of the U.S. House of Representatives, via the @unitedstates images project.
† Population comparison uses the U.S. Census Bureau, Vintage 2025 National Population Estimates (NC-EST2025) (as of 2025-07-01); “average American adult” is the mean age of residents 18 and older (49 years).